
Localizing a Global Design System for Japan
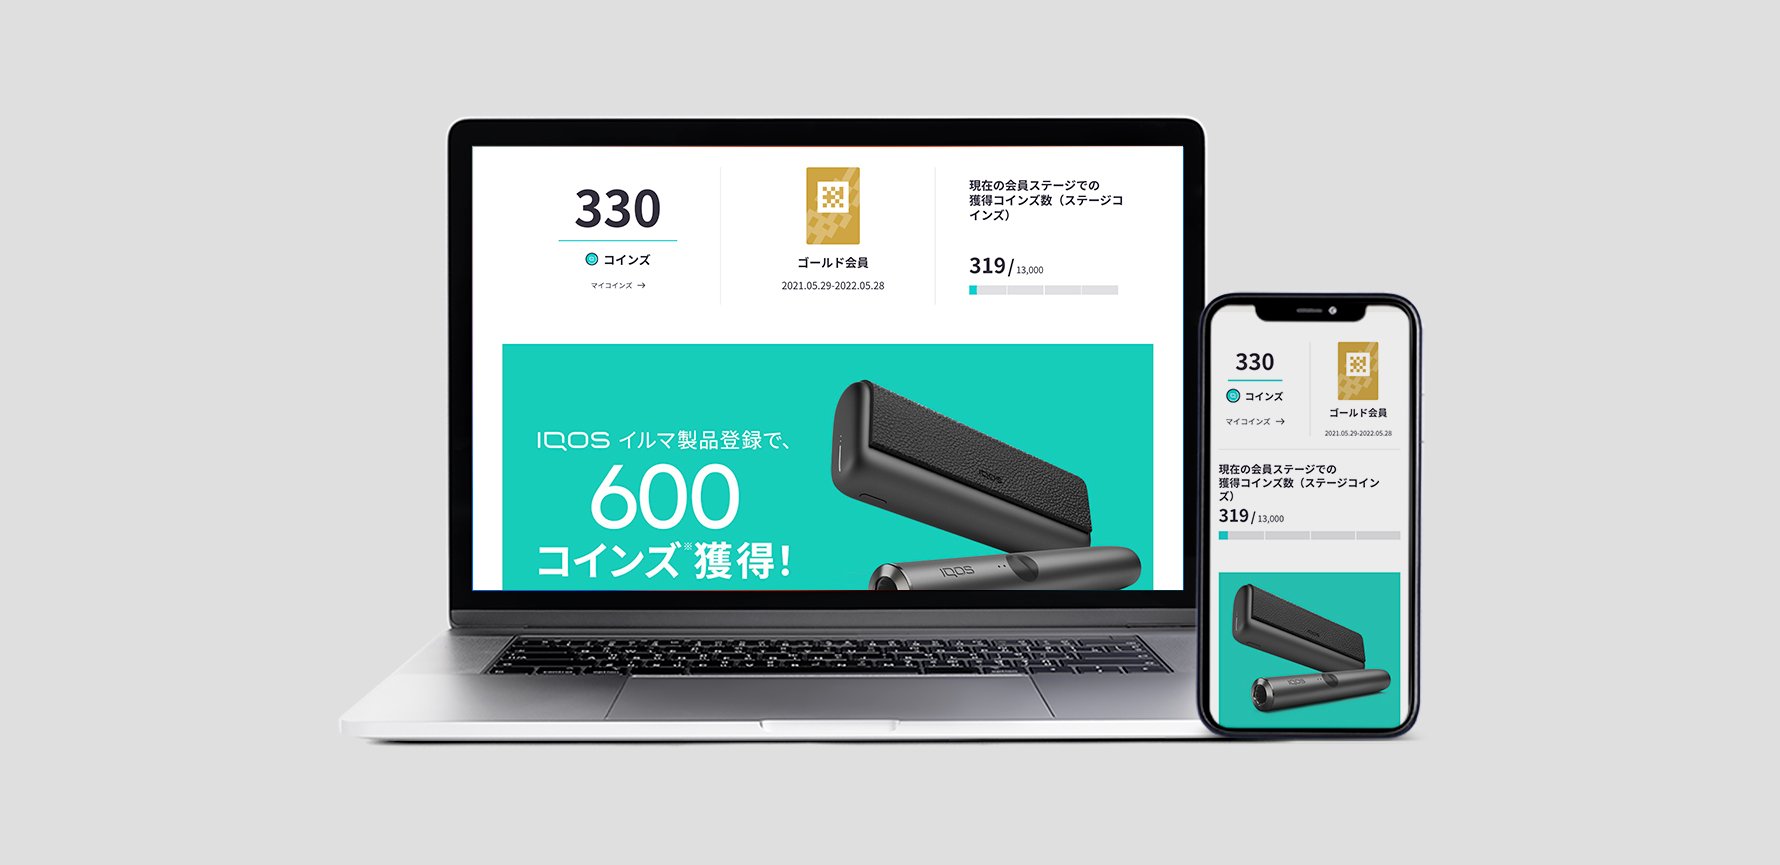
Research, design, and outcome
I led the Japan localization of IQOSPHERE across web and LINE, from research and information architecture to high-fidelity prototypes and reusable components. I worked with Product, Marketing, Legal, and Engineering to balance local member needs with the global design system.
Research evidence: NPS reports, user surveys, and behavioral patterns informed segmentation into Occasional, Regular, and Super Loyalty members. Journey maps connected those differences to content hierarchy and local touchpoints.
Design evidence: The artifacts below show prototypes, final UI, and the component framework. Together, they explain how the localized experience retained a reusable global foundation.
Outcome: The redesign contributed to 15.28% higher conversion and 29.48% more returning users. These are product outcomes tracked during rollout; they are separate from the discovery research.
Scaling a loyalty ecosystem across web and LINE
Growth, Localization, and Design-System Case Study
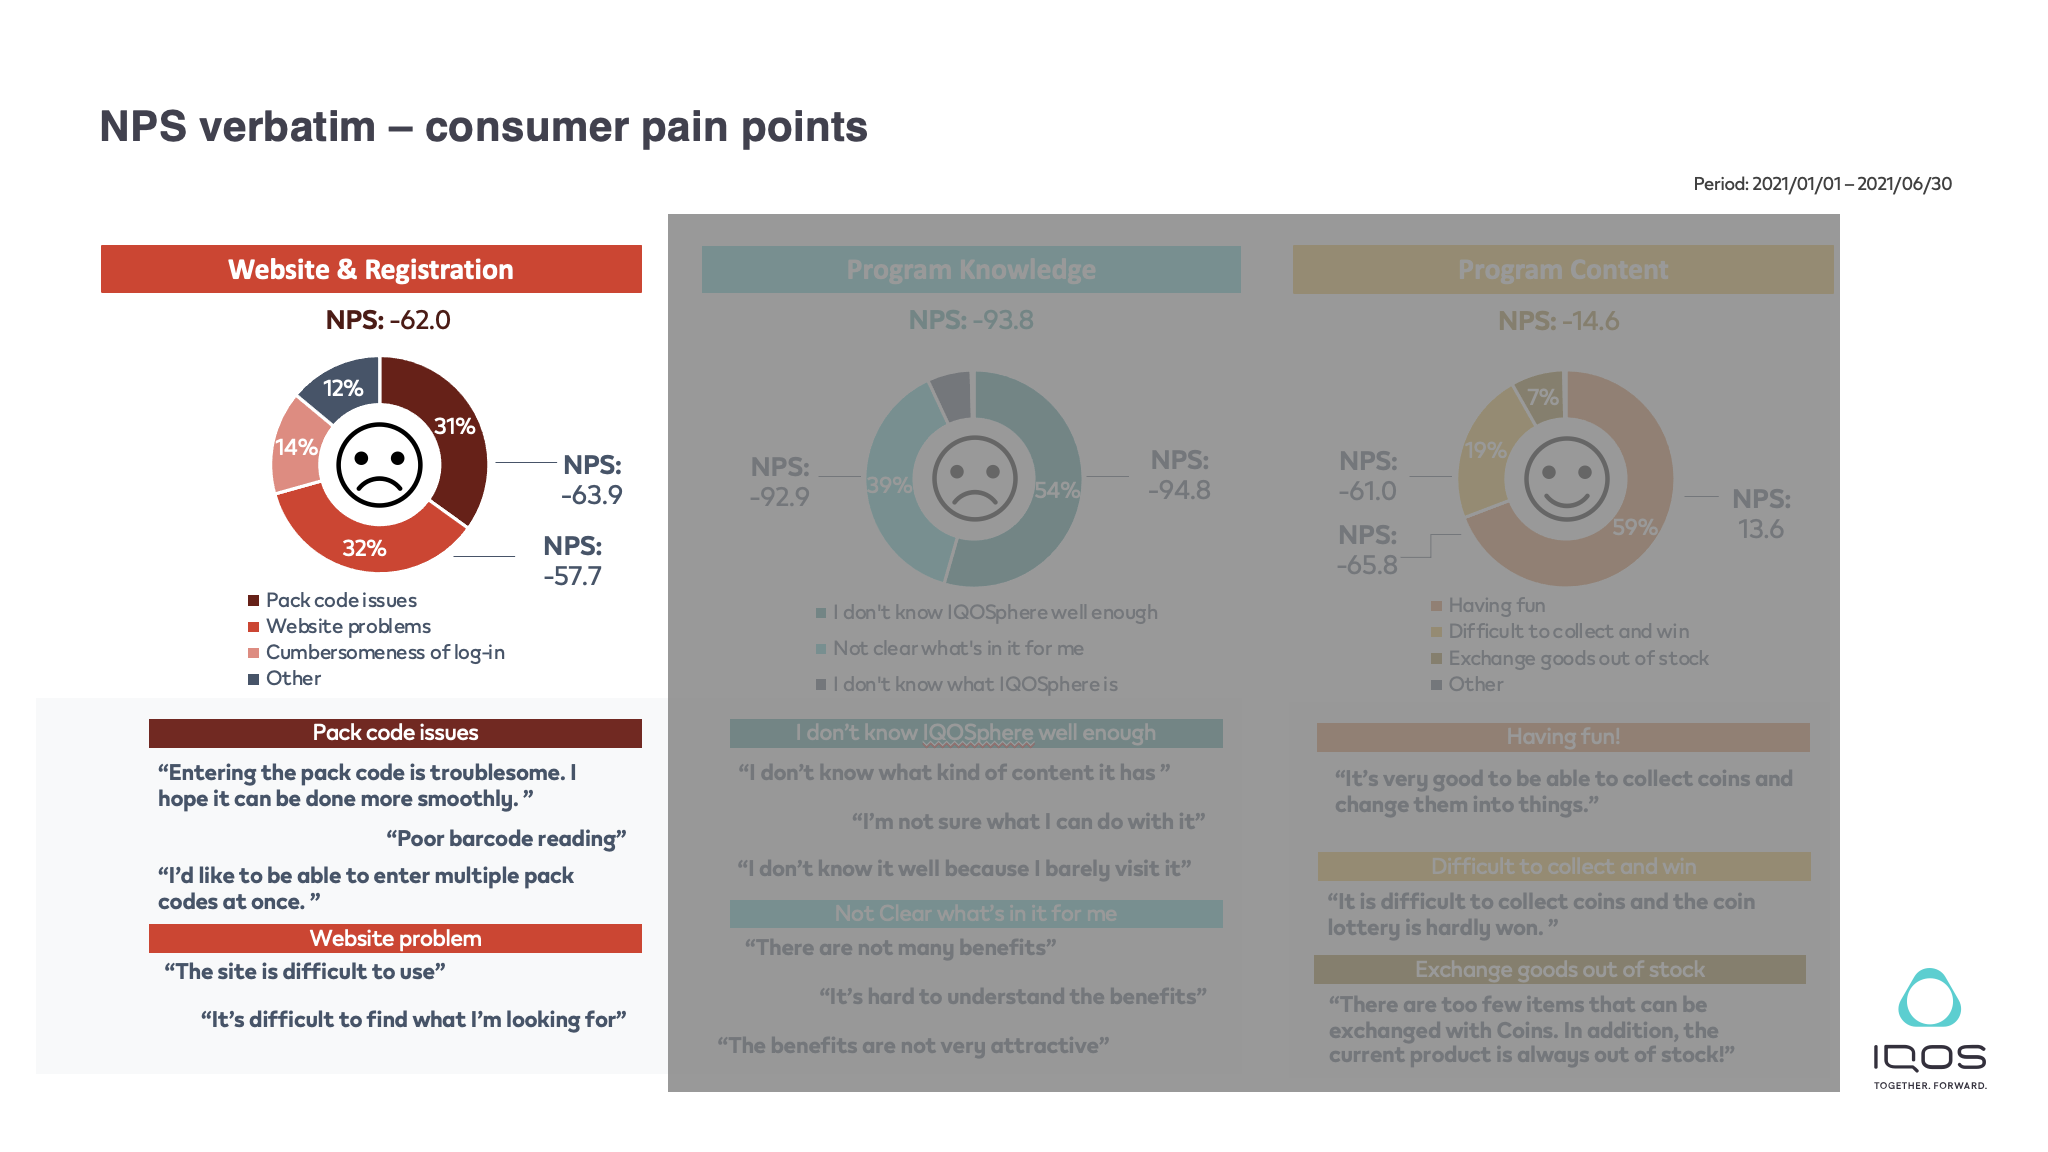
NPS Report Analysis
Analyzed NPS results to identify pain points and improvement opportunities.
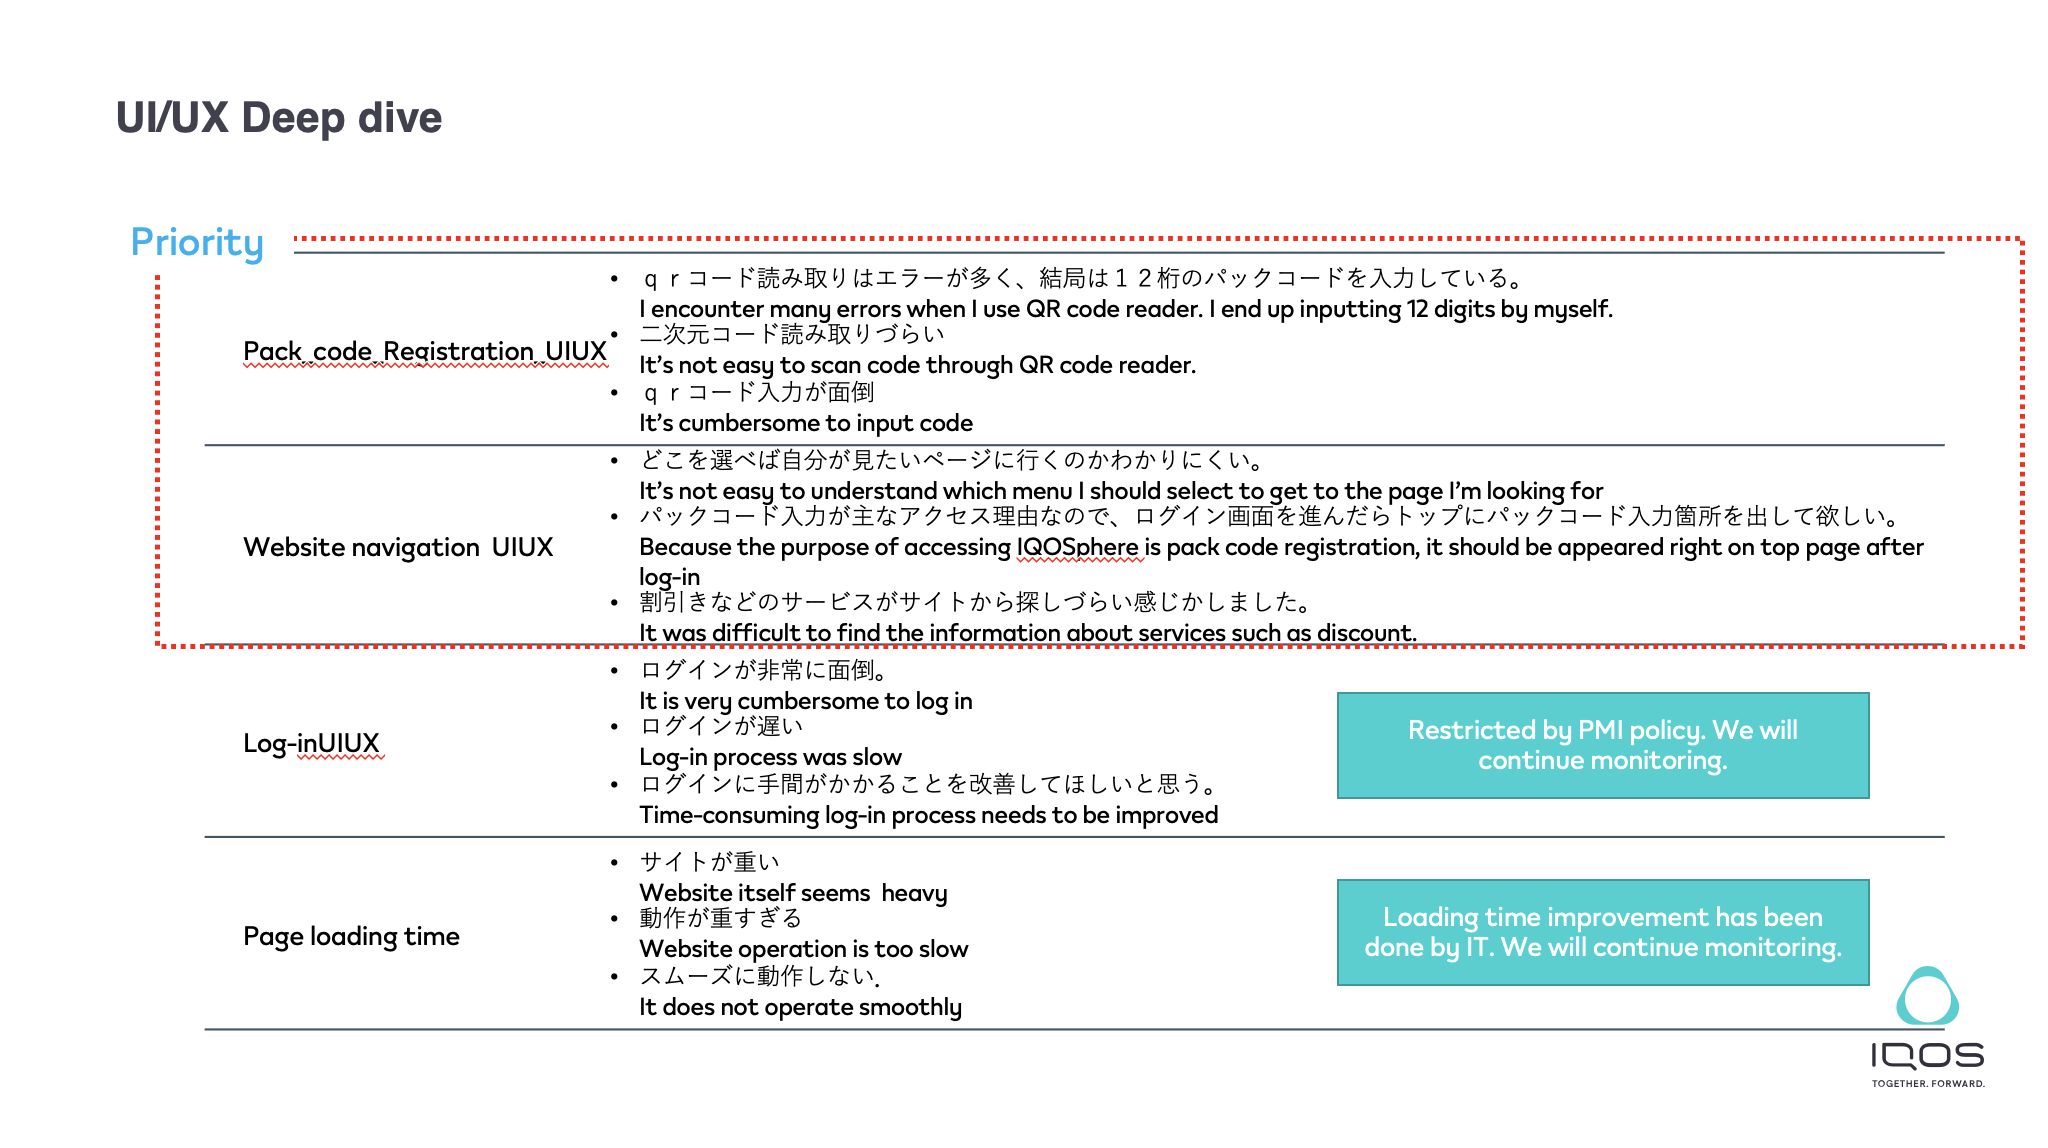
Used survey and interview findings to identify the features and programs users valued most.
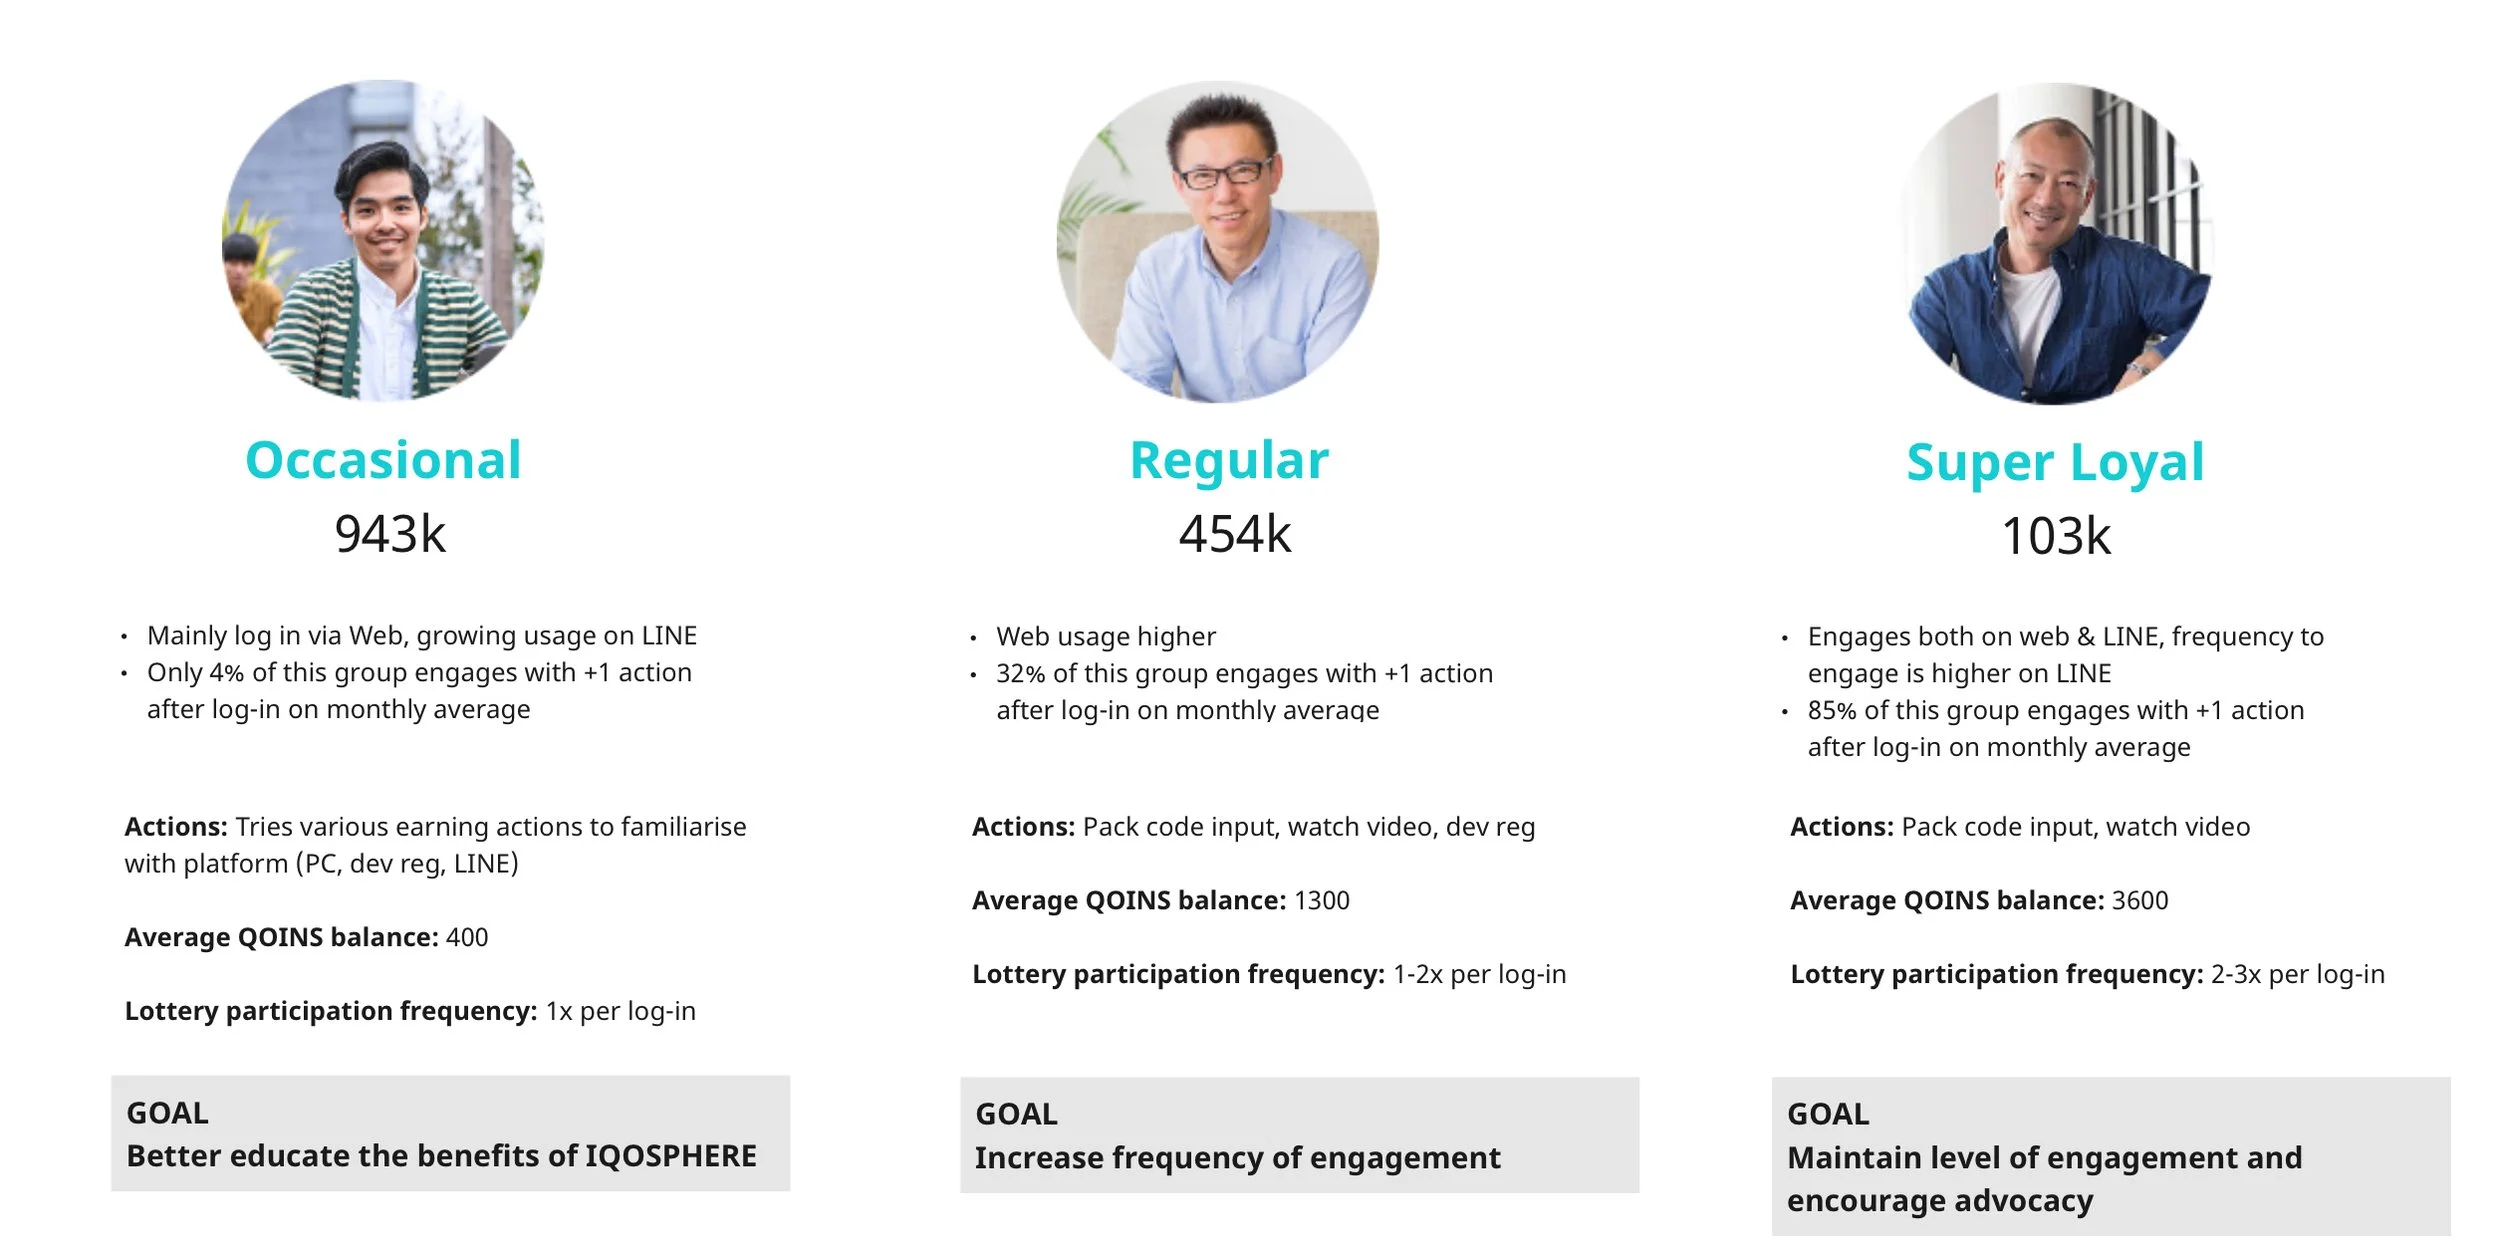
Segmented members by engagement level to understand distinct behaviors and needs.
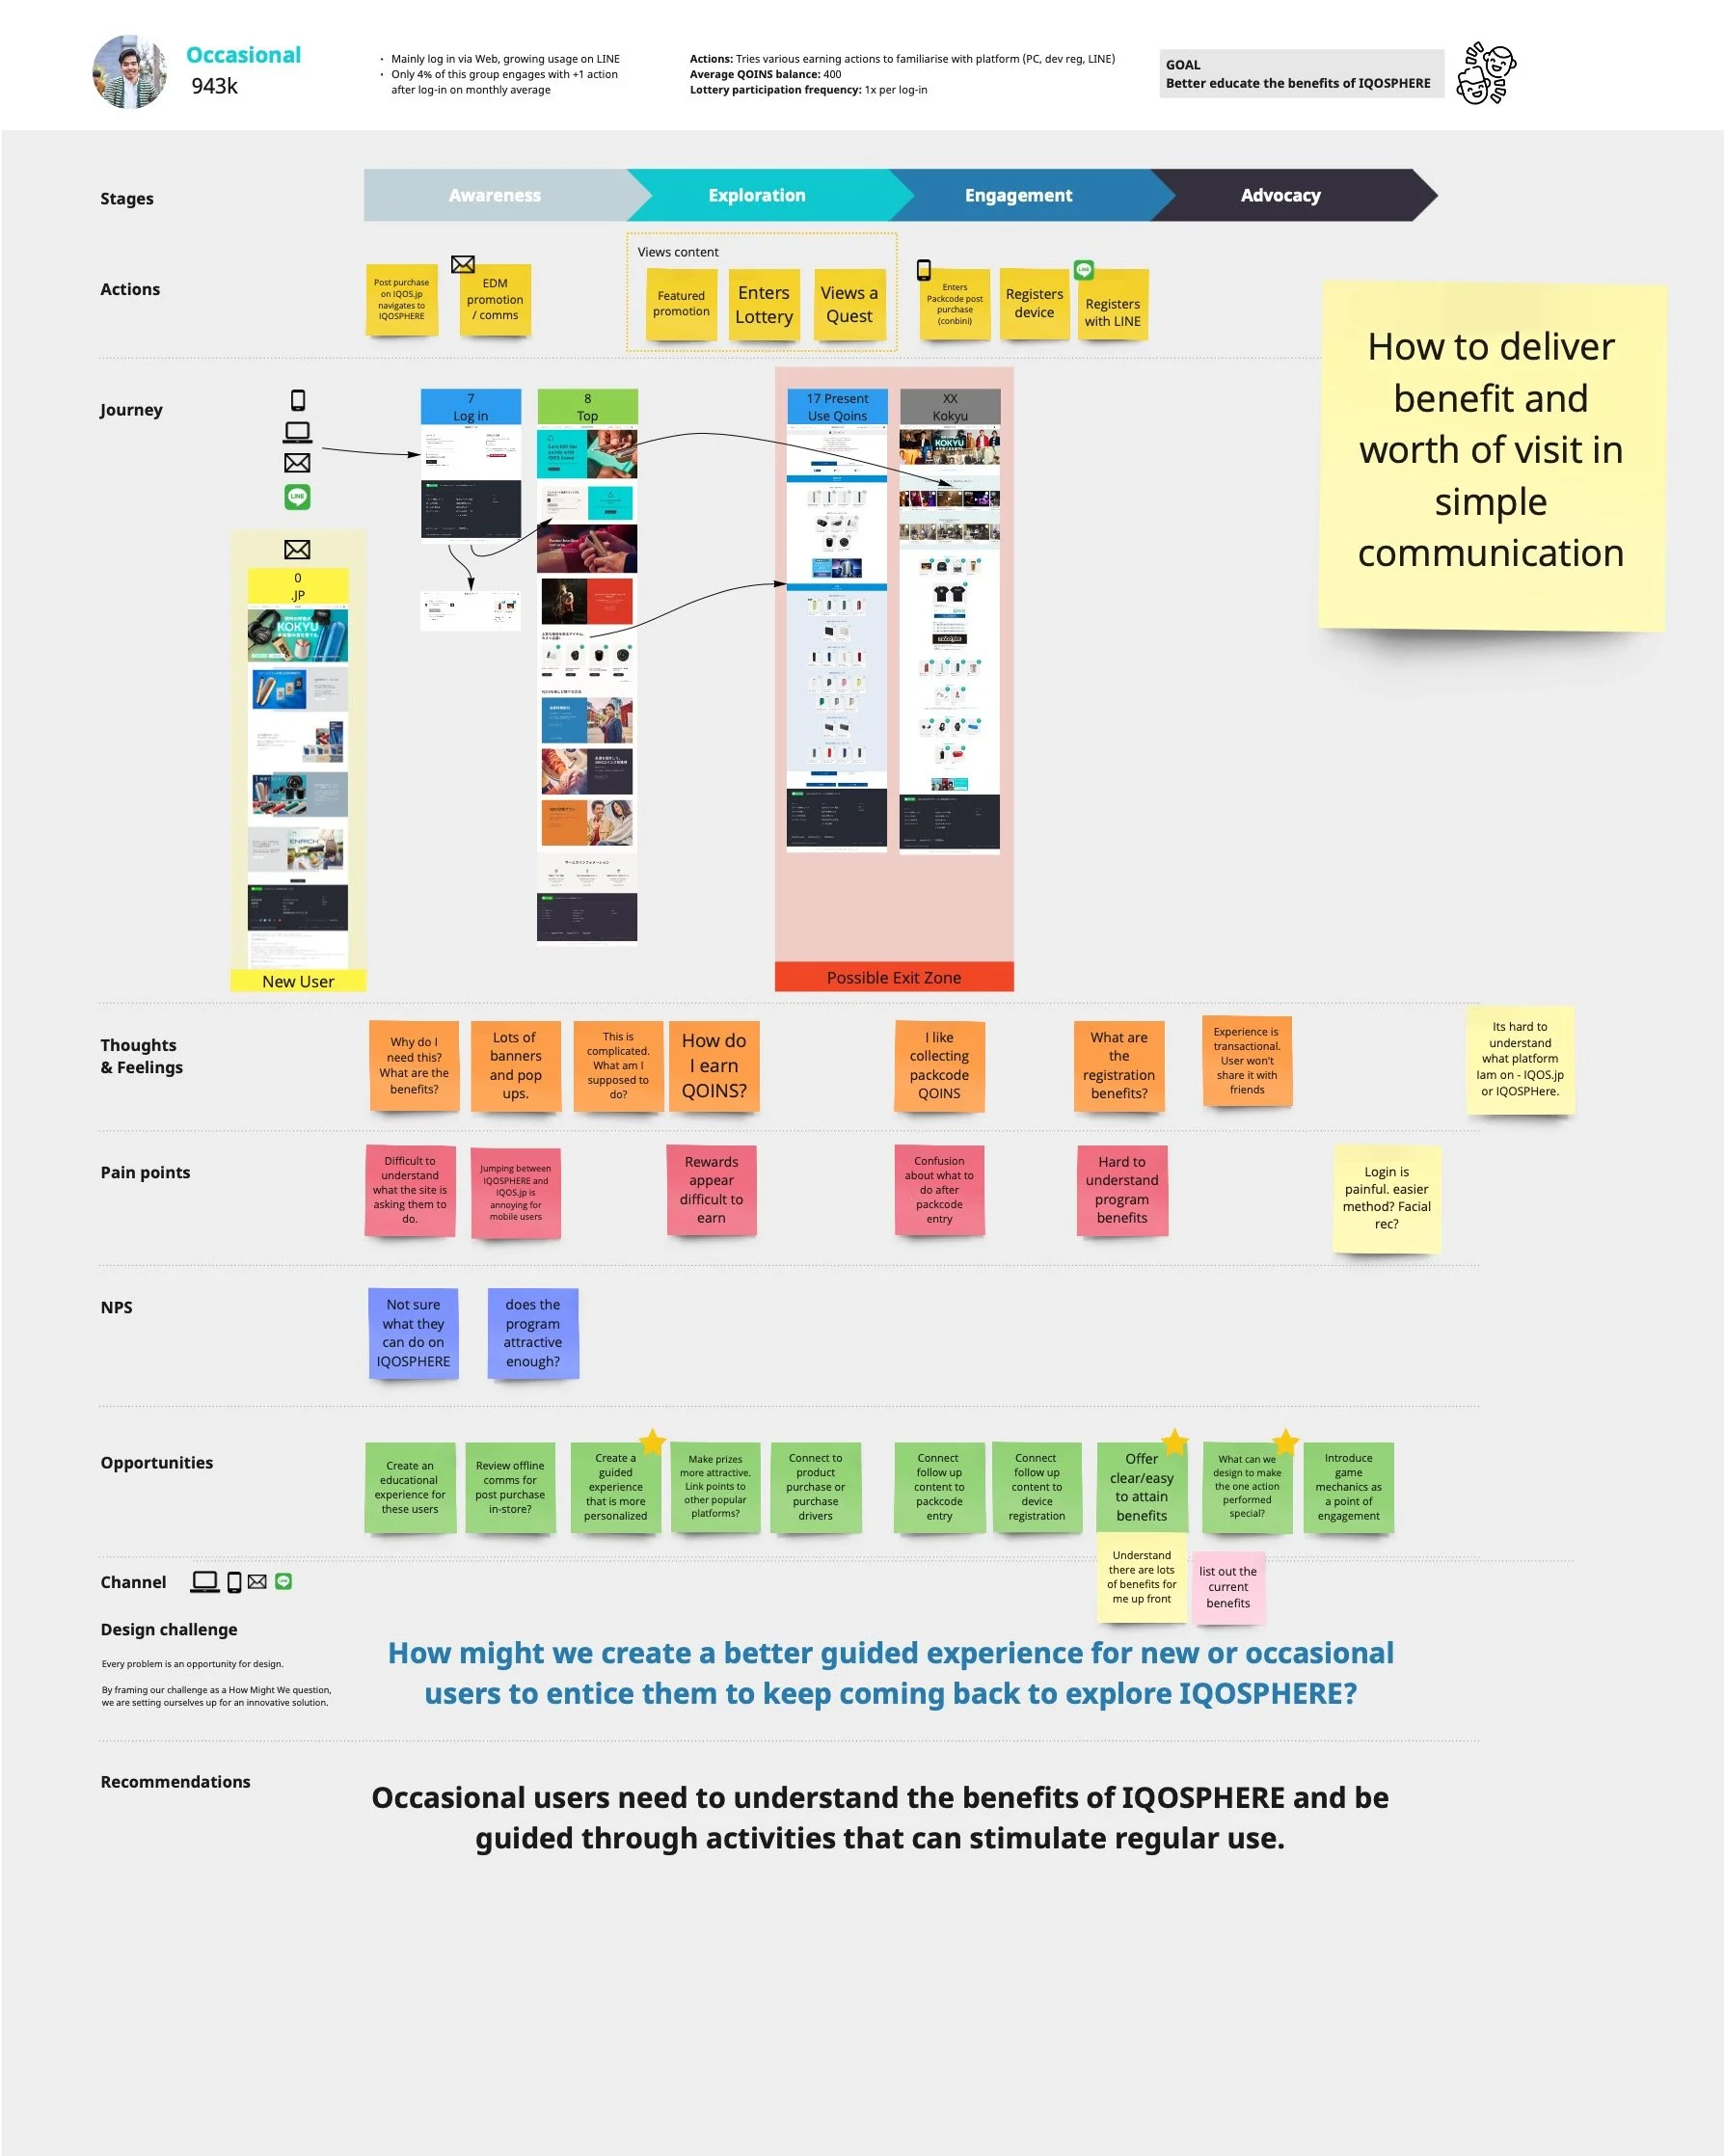
Mapped the occasional-user journey, including pain points and areas of interest.

Mapped the regular-user journey, including pain points and areas of interest.

Mapped the highly loyal-user journey, including pain points and areas of interest.
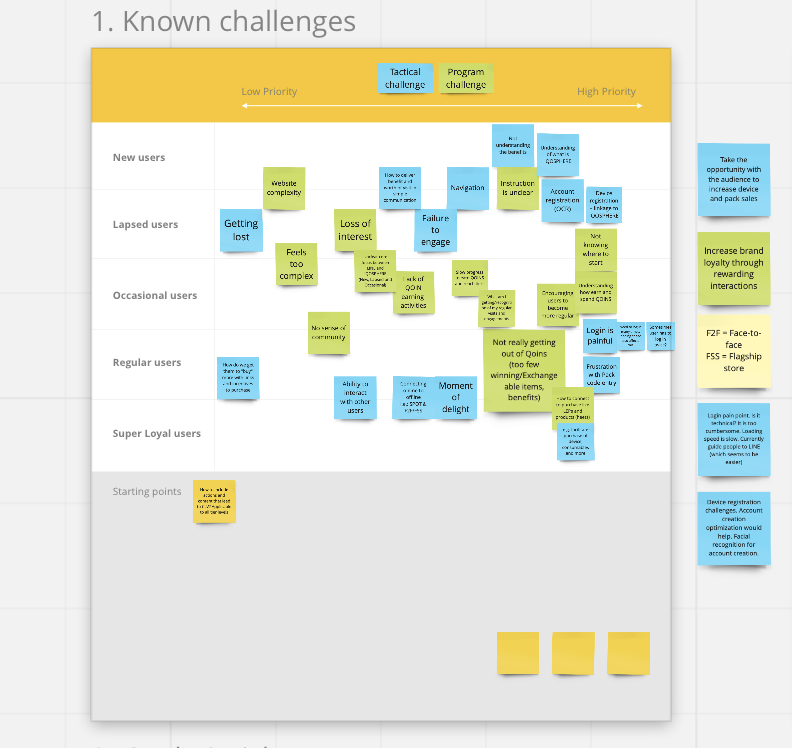
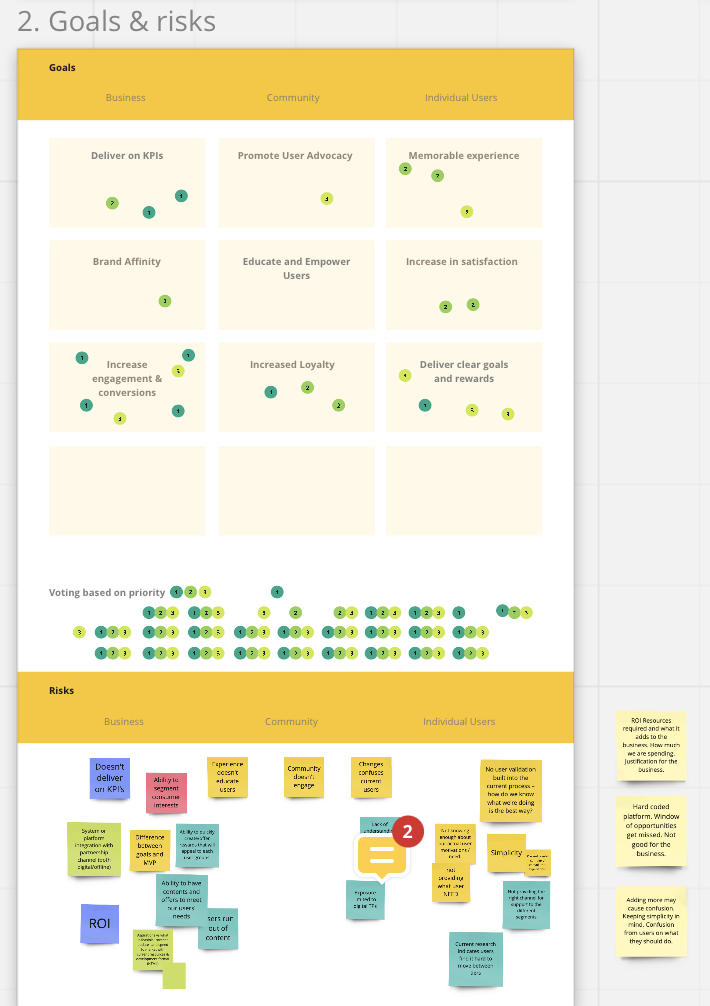
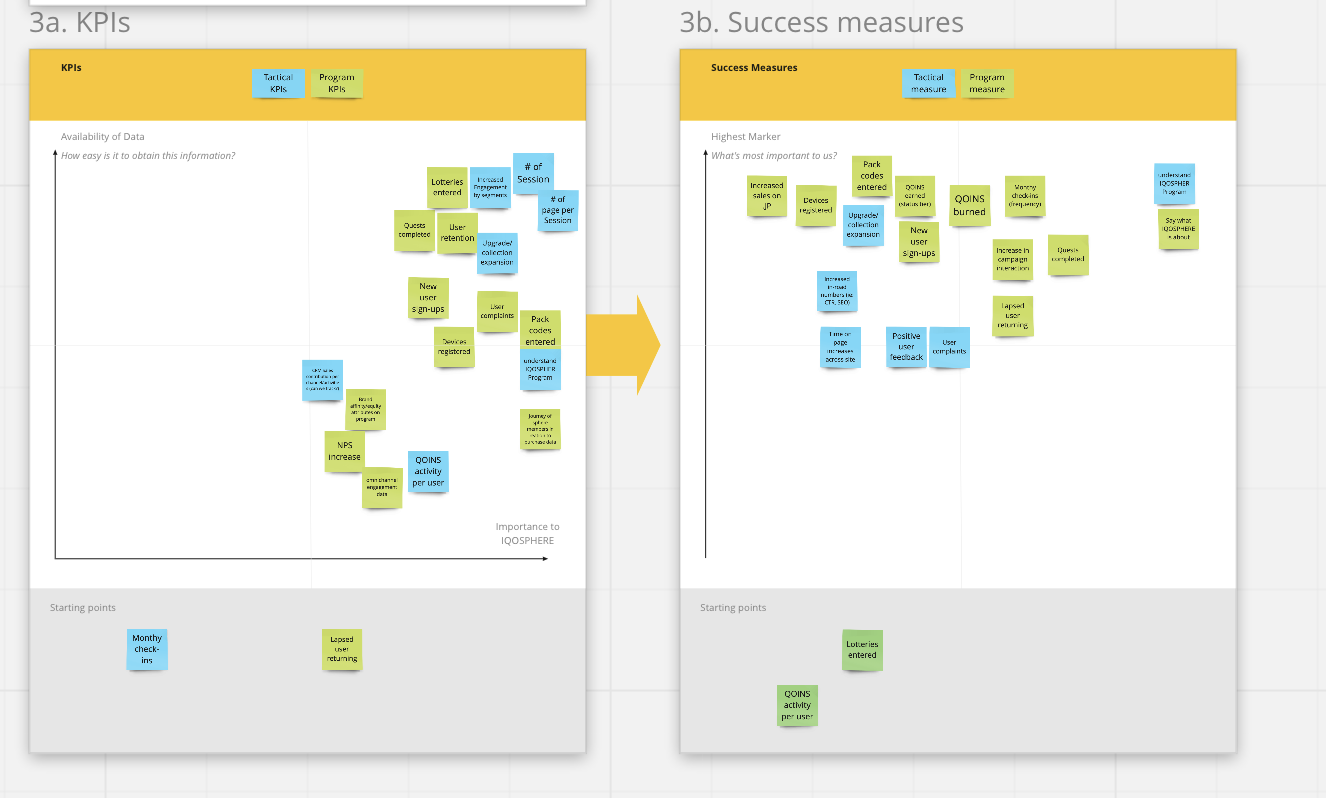
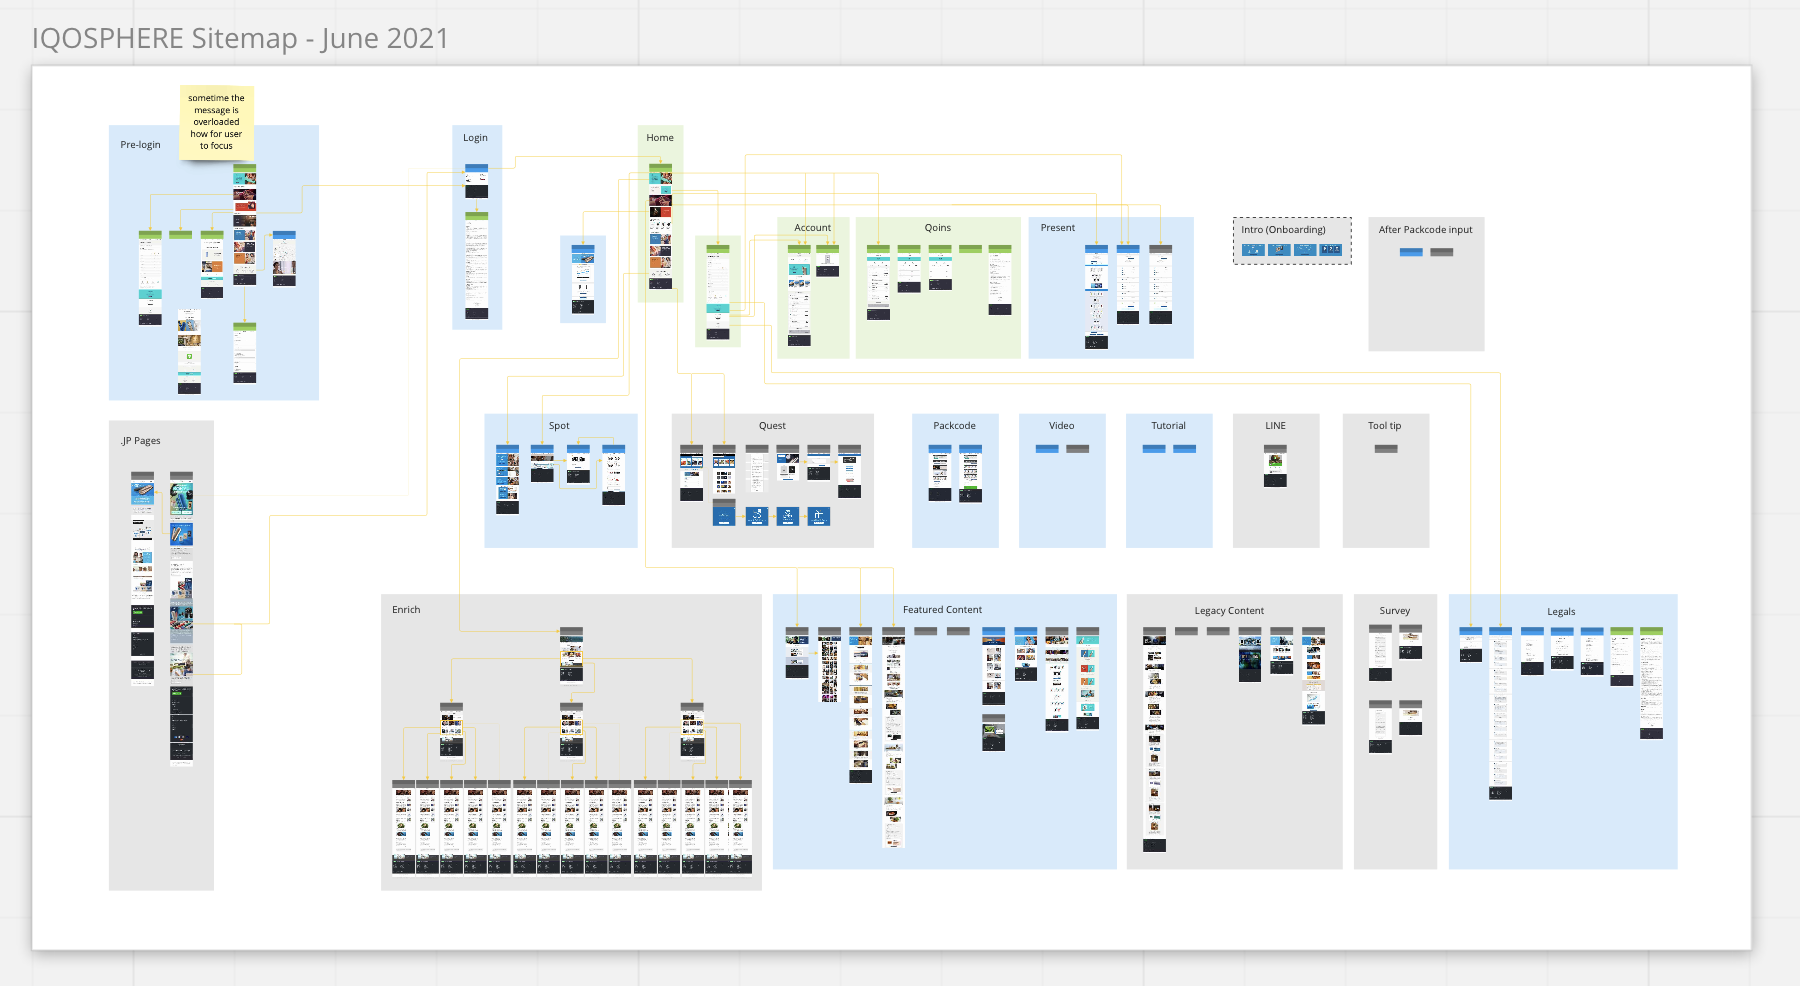
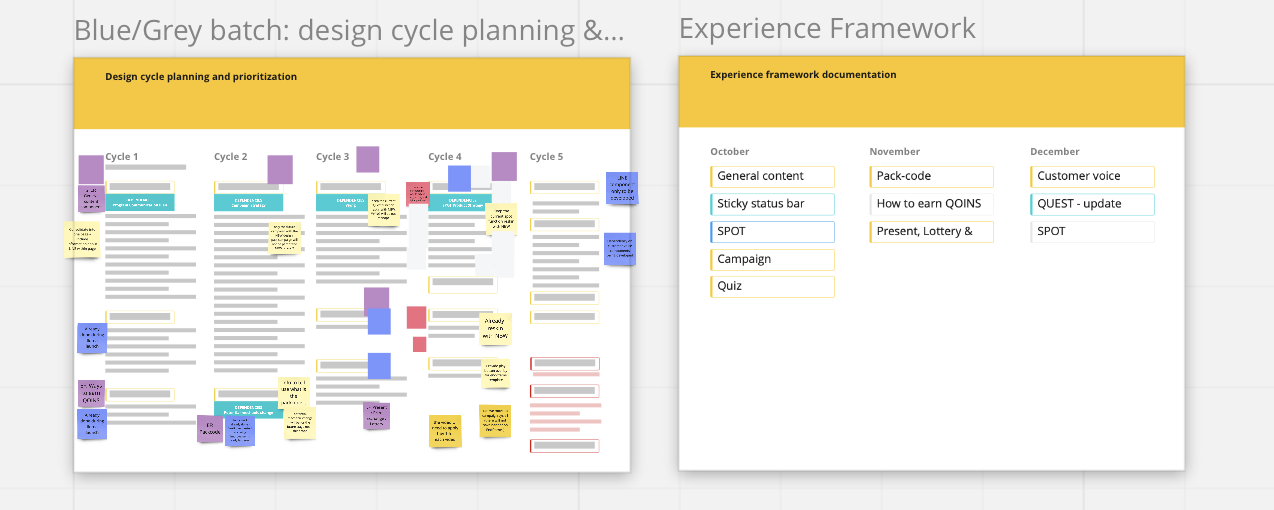
Page Prioritization
Prioritized page groups and information-architecture work for the redesign.
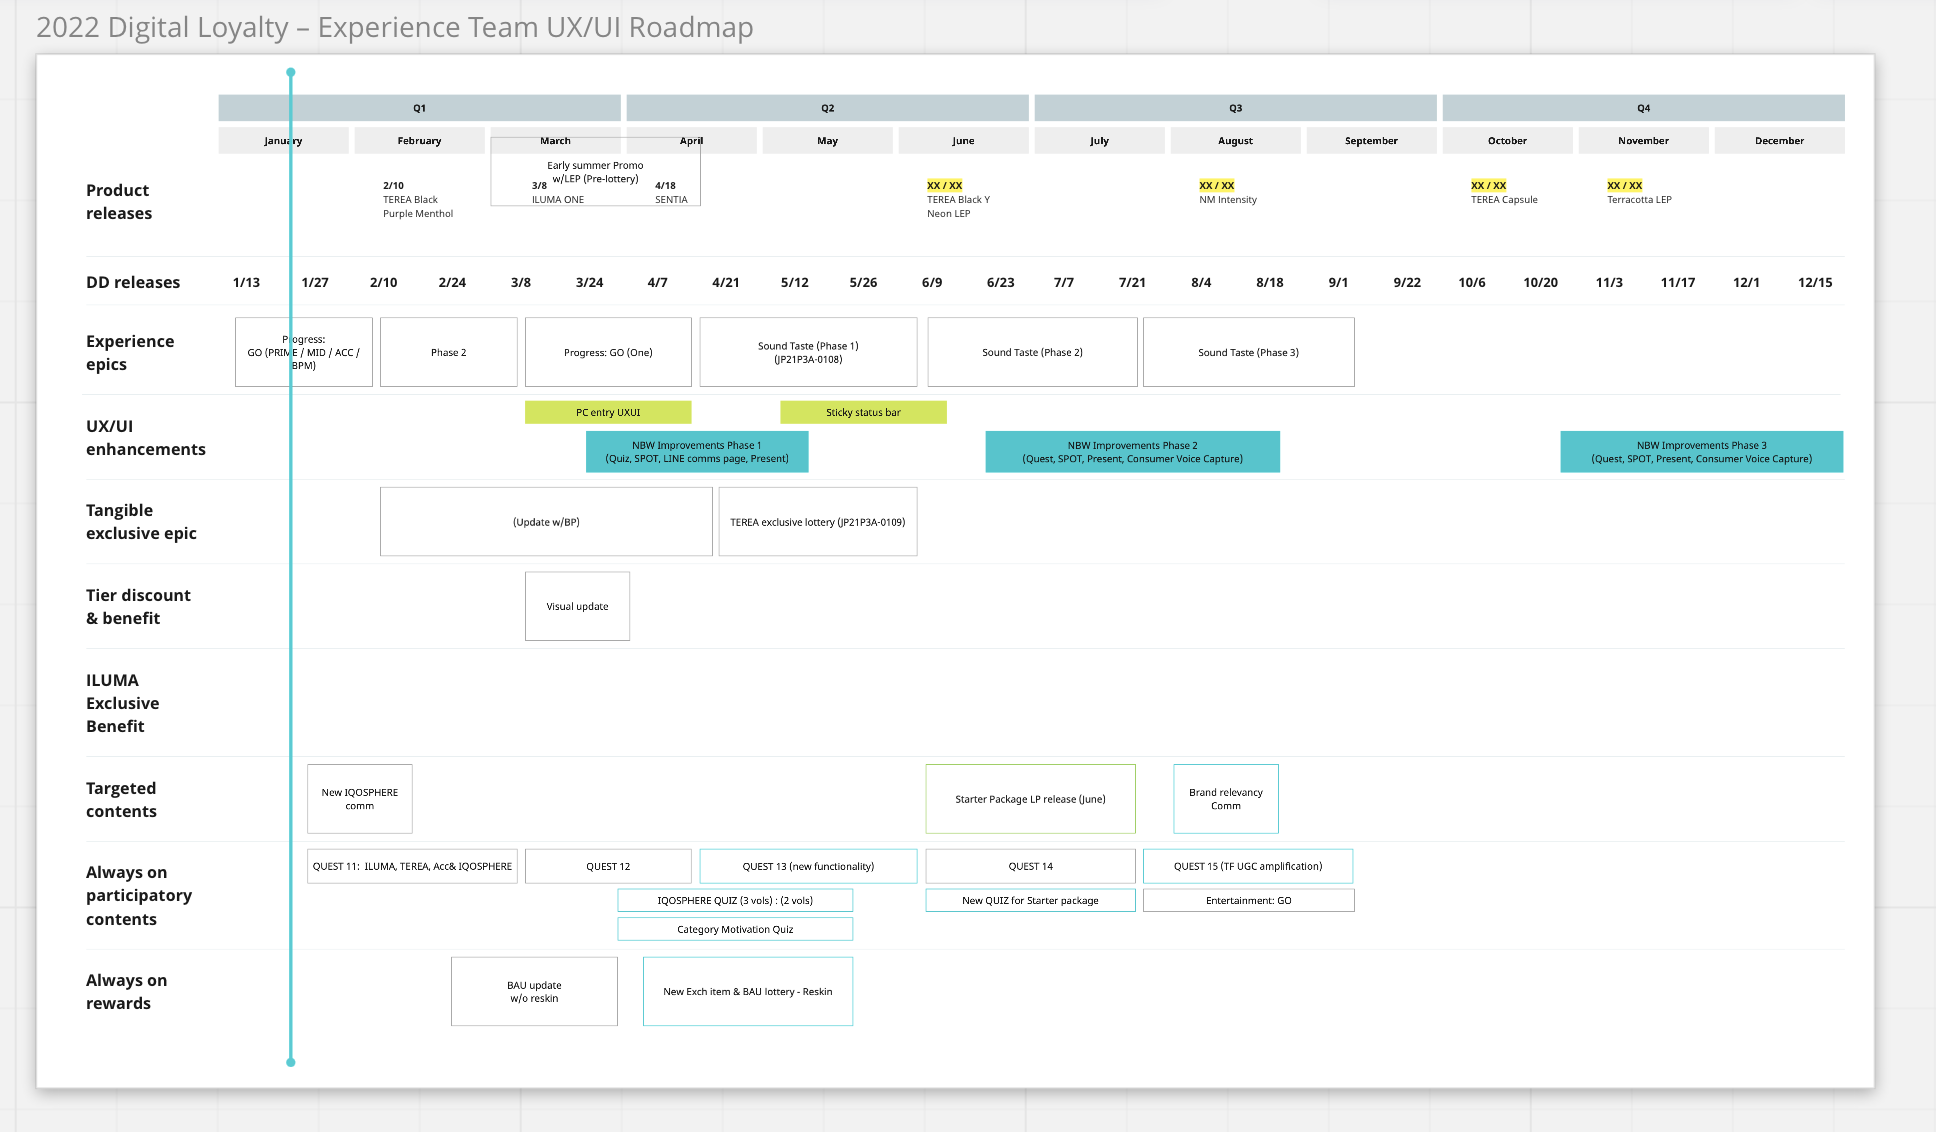
Roadmap Definition
Aligned leadership and functional teams on a phased delivery roadmap.


Prototype for testing: The pack-code MVP combines high-fidelity interactions with Marketing and CX assets. Compare this focused flow with the future-phase concept above to see the scope chosen for rapid testing.
Final UI: High-fidelity IQOSPHERE screens prepared for development, showing the localized content hierarchy and reusable interface patterns.
Reusable components: The atomic framework documents shared interface patterns for Marketing and Engineering. Compare it with the final UI above to see how the localized experience connects to a reusable system.
Design decisions and measurement
The trade-off: Translating the global template would miss local content and LINE needs. A fully custom Japan product would create a separate system. I selected component-level localization to retain the global foundation while adapting hierarchy and touchpoints.
My contribution: As UX/UI Design Lead and sprint facilitator, I translated research and workshop outcomes into information architecture, high-fidelity prototypes, and reusable components with Marketing, Product, Legal, Engineering, and global partners.
Visual progression: Compare the campaign and pack-code concepts with the MVP prototype, final UI, and atomic framework above. The captions identify the design purpose of each artifact.
Reported outcomes: +15.28% conversion, +29.48% returning users, and a reported +3.25% NPS change during rollout.
Measurement: Internal analytics tracked product outcomes; NPS surveys provided member sentiment. These reported changes do not isolate the redesign’s causal effect. Survey sample sizes, comparison dates, baseline counts, and the NPS calculation are not included; the reported NPS change is not converted into points.
Learning: Localizing reusable components helped balance local needs with global maintainability.